Day16:
Experiment #1: Charging & Discharging Capacitors
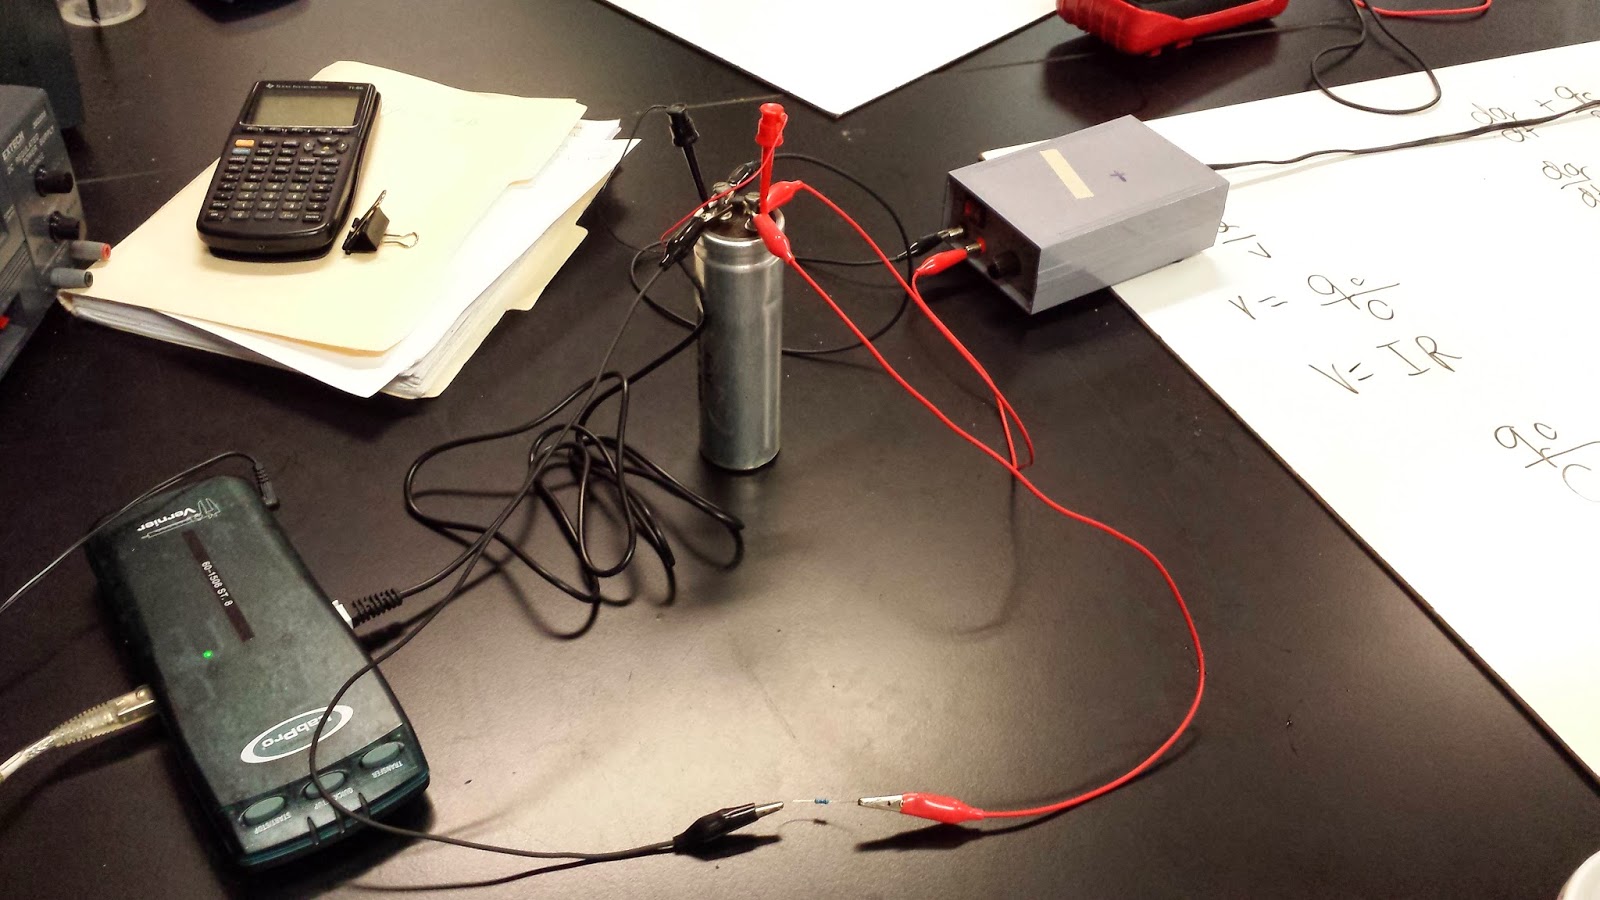
We used a power supply to charge and discharge a capacitor and used logger pro measure the voltage in the capacitor every few seconds. This gave a us a graph of our voltage over time.

The blue line is the capacitor is charging and the red line is when capacitor is discharging. The slope of these graphs suggest that the rate at which voltage changes over time, or dV/dt, is is not linear. By fitting the curve we found the coefficients of the equation of this graph of an exponential function.
No comments:
Post a Comment