Monday, April 28, 2014

Day16:


Experiment #1: Charging & Discharging Capacitors


We used a  power supply to charge and discharge a capacitor and used logger pro measure the voltage in the capacitor every few seconds. This gave a us a graph of our voltage over time. 


The blue line is the capacitor is charging and the red line is when capacitor is discharging. The slope of these graphs suggest that the rate at which voltage changes over time, or dV/dt, is is not linear. By fitting the curve we found the coefficients of the equation of this graph of an exponential function.

Tuesday, April 22, 2014

Day 15:

Activity #1: Measuring capacitance

For this Experiment we put aluminum foil between the page of a think physics book and set a multimeter up to measure the capacitance of this set up. In order to keep the capacitance consistent, we should have left the heavy side of the book on top.


We measured the capacitance of two separated sheets of aluminum foil which we varied in area and separation distance by folding the aluminum and adding more sheets of paper between the foils.


Our data suggests that the separation distance and the capacitance of the plates of a capacitor have a inverse relationship.


We measured  kappa,k, the dielectric constant. We calculated value of k to be 1.1,however the known value of k is actually 3.5. This is because we pressed the book in order to measure capacitance when the sheets were few.

Activity #2 Measure capacitance in series & parallel

Parallel
Series


We used a a multimeter and alligator clips to measure the capacitance of a capacitors in series and found that they  added in inverse, much as the resistors in series did.

Sunday, April 20, 2014

Day 14:


Activity #1


For this activity, we measured the current,  I, and voltage, V at several points in a parallel configuration as well as a series configuration. 


Activity #2 Decoding color for resistor


In order to practice recognizing the values or various resistors, we collected 4 band code resistors and 5 band code resistors and used the code legend to determine the rating of the each resistor.
.


Then we compared this calculated value to the measurements we took with an R-reader
For the 4 band code resistor we had about 99% accuracy. For the 5 band code resistor, we had slightly less with 97%.


Activity #3: Equivalent Resistances For Networks


We set up various resistors with known resistances in a combination of series and parallel configurations according to diagram that we were show. We calculated the value of its equivalent resistance and then we compared that value to the measurement taken by the R-Reader.


We were off by about 2%, which we considered a success.


Tuesday, April 15, 2014

Day 13:

Activity #1: Spreadsheet


Estimate of the Potential from a Charged Ring:


We separated the charges into 20 intervals and then added the potential of each in point P.


When point P is instead near the top of the circle, the distance between the point and the charge, r,  varies.


 Electric Potential Lab


For this experiment we required a cork board, alligator clips, semi-conductive paper, a voltmeter and a power supply. With these materials, we set out to find the potential difference between two points.


The graph of our data suggested that as the separation distance increases, the voltage also increases. This graph is parabolic.

As a takeaway, we learned that potential, being a scalar quantity can be added in kind.

Saturday, April 12, 2014

Day 12:  

Group Quiz!


For our quiz we were asked to put together an arrangement of various supplies in such a way that it would produce the brightest possible light. The group across from us has to do the opposite: produce the dimmest possible light. Our supplies included two batteries, four alligator wires, and two light bulbs.


We connected the two batteries in series to produce larger voltage (potential energy). This effectively doubled the voltage. Then we connected the two light bulbs in parallel which reduced resistance, as light bulbs act as resistors and resistances add in series but the reciprocals add in parallel. With less resistance the current increased with then increased the power.


We attempted to convey this arrangement with our amazing art skills. Here is the comparison between our masterpiece and the conventional schematic:


Experiment 


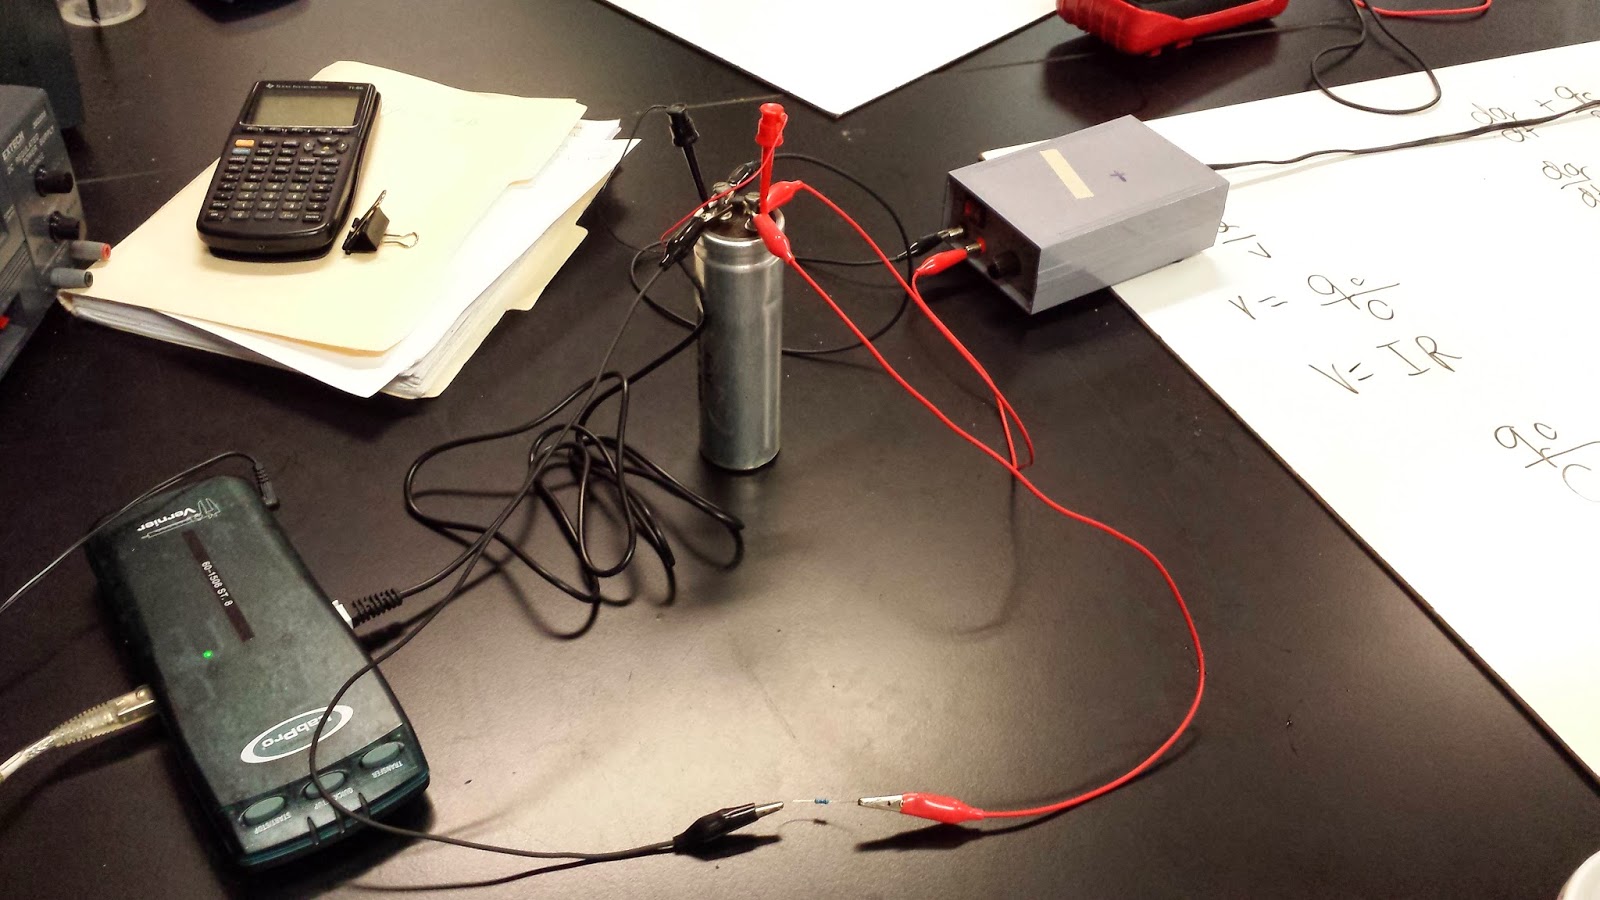
For our experiment, we required a power supply, a coiled conductor and a temperature probe.


Calculation :  ∆T


Temperature Vs. Time graph


The change in temperature is within our uncertainty. The graph shows that ∆T for 4.5V is around 3°C.
Our uncertainty calculation is 2.2°C±2.8. For the 9V the graph shows ∆T of around 10°C. Our calculation was 4.5±5.6.


Tuesday, April 8, 2014

Day 11: Current Voltage and Resistance

Experiment #1


This experiment required an ammeter, a voltmeter, resistors, alligator wires and a power supply which we would use to record voltage and current data through a coiled conductor. We did six runs and plotted the data to illustrate their relationship:


The slope of the graph of our plotted data is linear, so the voltage,V, is directly proportional to the current, I, with a constant coefficient. The constant is the resistance, which means that the slope of an V vs I graph is magnitude of the resistor.

When two different resistors are used, the graph of their data produces two different slopes.
In the second experiment we will find out what factors that effect the magnitude of the resistor.


Experiment #2


The graph suggests that with a longer conductor the resistance increases. The linear graph suggests that the resistance is directly proportional to the length of the wire. 


In the graph, the red data point is the the resistance of a copper conductor. It is clearly not similar to our other data. Since this is a different material, we can infer that different materials also affect the resistance.


Therefore, we conclude that the magnitude of the resistance depends on the length, material, and the cross sectional area.


Wednesday, April 2, 2014

Day Ten:


Activphysics

Electric field is directly proportional to the number of charge inside the sphere.


When it is a Shell, charges moves to the surface, so it does not change the number of charge. Since the number of charge does not change, Electric field does not change either.


E=0 because the radius of Gauss' sphere is smaller than the radius of the charged spherical shell.