Tuesday, March 25, 2014

Day Nine:


Experiment #1: Flux


Apparatus: 
  • Bed nails representing flux.
  • Square wire representing surface.

We recorded the relationship between degree of the rectangle oriented vs. how many nails fit in the square wire.


The graph of flux(number of nails) vs. degree(radians). It looks like cosine graph. 

ActivPhysics


1. Area of the oval does not change the magnitude of the flux as long as the charge is inside the oval surface.
2. When the charge is outside the oval surface, the magnitude of the flux becomes zero.
3. When the sign of electric charge change, the sign of the flux is also change. 
When the magnitude of the electric charge is increasing/decreasing the magnitude of flux also increasing/decreasing.


Sunday, March 23, 2014

Day Eight:

ActivPhysics

Simulation for question number 1 - 2:
This simulation shows the characteristics of electric charges.
Equal charges' electric field point away each other, while different charges' electric field point toward each others.


Simulation for question number 2:
Representing the electric field: electric fields come from the positive charges that move into a negative charge.


Simulation for question number 3-5:
Uniform field simulation -electric field in every region between the two plates is the same.


Spreadsheet

Finding the magnitude of electric field in 4 different points. formula E = kq/(r*r).


E-Field Vectors from a Uniformly Charged Rod

The total charge of this rod is Q = 5x10^(-8). We divided the charge into 10 equal parts, so Q = 5x10^(-9). Each charges will produce different electric field in point P because the distance between point P and 10 charges are different.


E-Field Hokey

 Level 2:


Tuesday, March 18, 2014

Day SevenL

Interactions of Scotch Tape Strips

We used Scotch tape. Each side of the tape has a different charge.

 
Top strips vs. Top strips: Repel


Top strips vs. Bottom strips: Attract
Bottom strips vs. Bottom strips: Repel


Conclusion: This experiment proved there are different charges. The top side of the tape has one type of charge and the bottom has another opposite type of charge. Two different charges are attracted to each other, while two like charges repel each other.


Electric Force Law Video Analysis 

Calculation: Rearrange F in term of mass of the object, the distance it moves from x-axis, and the length of the rope.


The Slope: The slope means that the electric forces are inversely proportional to distance between two objects.

Tuesday, March 11, 2014

Day Six:


Diesel Cycle

The Efficiency of this diesel cycle is 63%. According to the textbook The efficiency of the diesel cycle is about 65% - 70%, which is consistend with our calculations.  


Extra credit:

I learned that 3D printers are really cool and have actually started researching their applications!

  Day Six:

Activity 1


Analyzing simple Heat Engine cycle


We found that the total of work is the same as the area of the rectangular.


Demo #1 (Mass Lifting Machine)


Apparatus

  • Syringe: measure pressure.
  • Hot Water: to add heat energy to the system, so the system does positive work.
  • Cold Water: to remove heat energy from the system, so the system does negative work.
  • Flask: to hold water.


Pressure Vs. Volume gas we got from the demo above.

Volume went down when mass is added and when Flask is in the cold water.


Activity 2 Carnot Engine Cycle


Activity 3 ActivPhysics


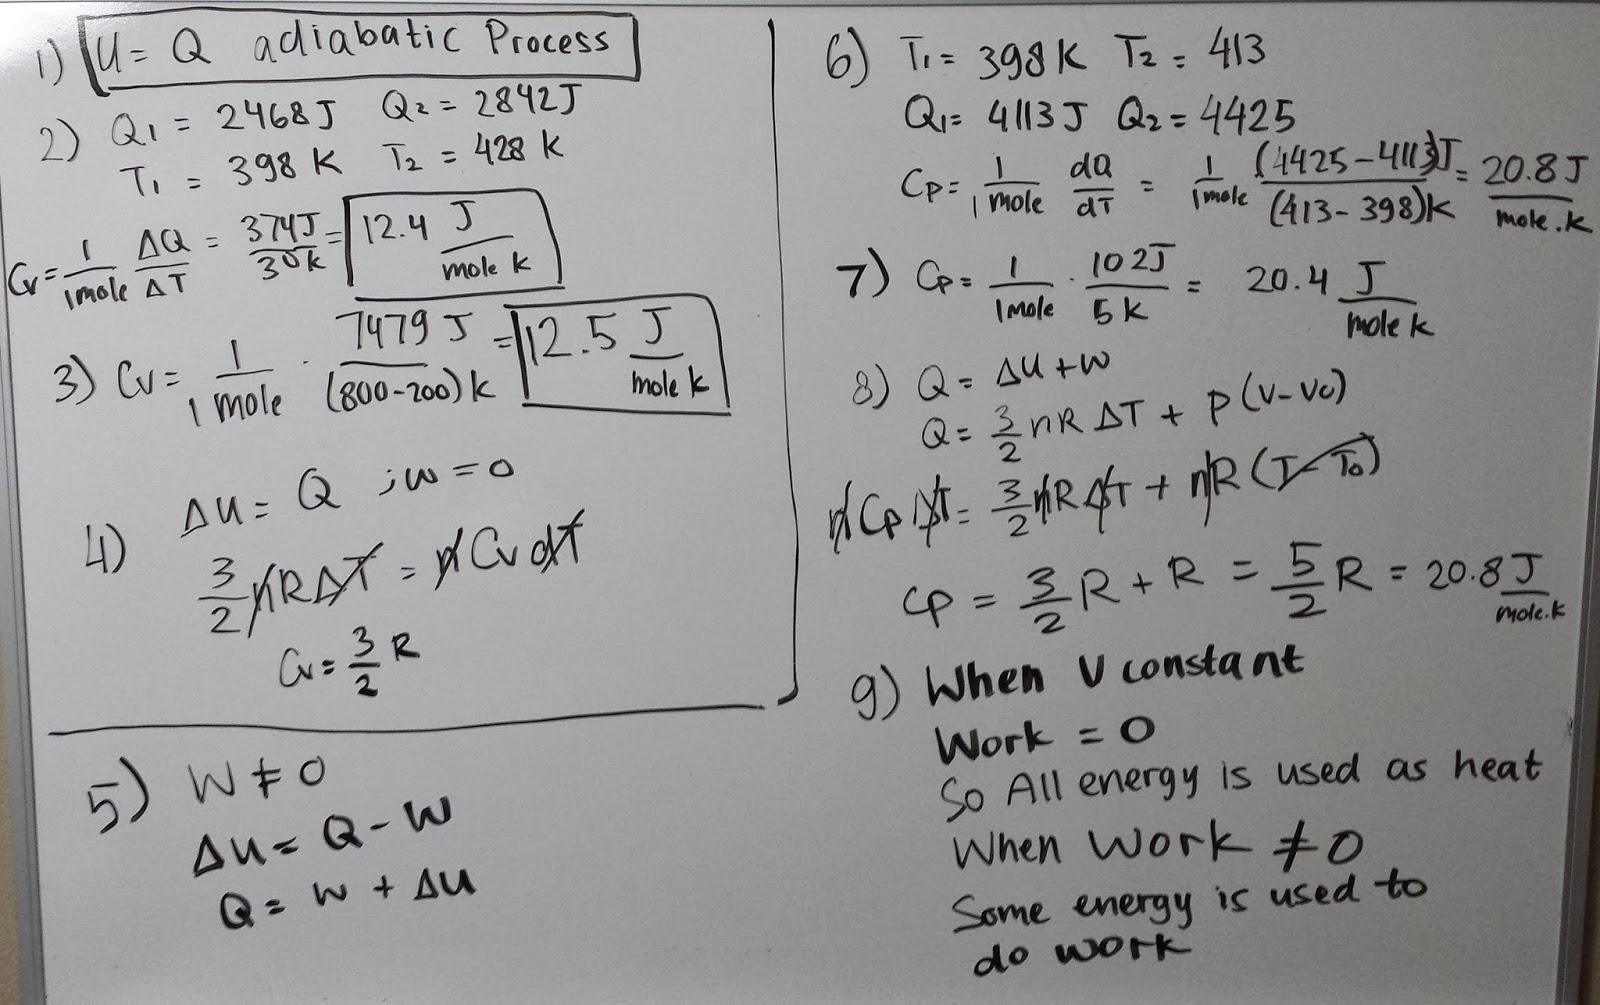
Q is larger in second picture because W is not zero and Q = U +W.


Answer to the activphysics problems:


Sunday, March 9, 2014

Day Four:


 Apparatus:

 We used a  fire syringe and cotton.

The purpose of the fire syringe is to compress the air inside the tube as quickly as possible.


Calculation:


This is an example of an adiabatic process because we compress the air so quickly that  their is no significant heat flow. As the volume is compressed the temperature goes way up at a tremendous rate. We predicted that the temperature inside the tube will be around 2340°F for an a brief instant, and since cotton will catches fire when its temperature is more than 451°F, the cotton will light up.


Activ Physics: 


An isobaric process is a process in which the pressure does not change, so ∆U, Q, & W are not zero. An isochoric process is a process in which volume does not change, so W=0 and ∆U=Q. An isothermal process is a process which temperature does not change, so ∆U, Q, & W are not zero.

Tuesday, March 4, 2014

Day Three:


Experiment 1

We used a glass syringe to measure the change in volume and a cork to prevent the gas from leaking.


This graph means that temperature and volume have a linear or proportional relationship and that the slope happens to be the ratio of their differences. That R^2 = 0.9712 suggests that data has a good linear correlation sin 1 is a perfect linear relationship.


Temperature is directly proportional to volume. Temperature is also directly proportional to pressure and  pressure is inversely proportional to volume. Their relationship is constant so we can manipulate the equations to appear in more convenient ways.

Saturday, March 1, 2014

Day Two : Linear and Thermal Expansion


Demo 1


Apparatus:


Our first experiment equipment consisted of  is a ring and a ball. Our second consisted of a bimetallic strip.


When we added heat to the ring, the inner and outer radius expanded and enable the ball to go through the ring.


When we added heat to the bimetallic strip, one metal expanded more, so the strip bended. When we removed heat, one metal shrank more, so the strip bended in the opposite direction.


Demo 2


This demonstration consisted of steam, bar, and a pulley.

Steam heated the bar to 100 C, so that the bar expanded and rotated the pulley.


 From this graph we determined how many degree the pulley rotated.


We had to find the relationship between the bar's linear expansion and the angular acceleration of the pulley and we used the propagation formula to find the uncertainty. The diameter was on the only variable we took into consideration because other variables do not have significant effect on the uncertainty.


Phase Changes

Experiment 1

We use a foam cup, a ceramic cup,  an immersion heater, and a thermometer probe for this experiment.


This graph says the temperature of the water is increasing linearly until it reached about 100C, when the temperature stopped rising and became constant.


From the data on the graph, change in mass of the water, and the measured power output from the immersion heater, we can calculate  the Latent Heat of water vapor.

The10 groups in our class got 10 different values of heat vaporization.
The standard deviation is much larger than 1, so that means that the experiment is not precise. According to the textbook, the real value of heat vaporization is 2256000 J/kg.


Thermal Property


Demo 3 Pressure Vs. Volume (gas)


We predicted the relationship between pressure vs. volume of gas was going to be inversely proportional. The demo that the professor did showed our prediction to be true. When volume increases, pressure decreases and when volume decreases, pressure increases.


Demo 4 Pressure Vs. Temperature (gas)

Pressure and temperature have a linear relationship according to this graph. This mean that when the temperature increased, the pressure also increased, and when the temperature decreased, the pressure also decrease.


Summary


Today we learned that an object's dimensions will expand or shrink in the same way, and also to relate length change and angular acceleration of a pulley. Also We learn how to find the heat of vaporization of any material. In our experiment, we use water because it is cheap and accessible. Finally, we learned the relationship between Pressure Vs. Volume and Pressure Vs. Temperature.