Tuesday, June 3, 2014

Day 24:

Experiment #1


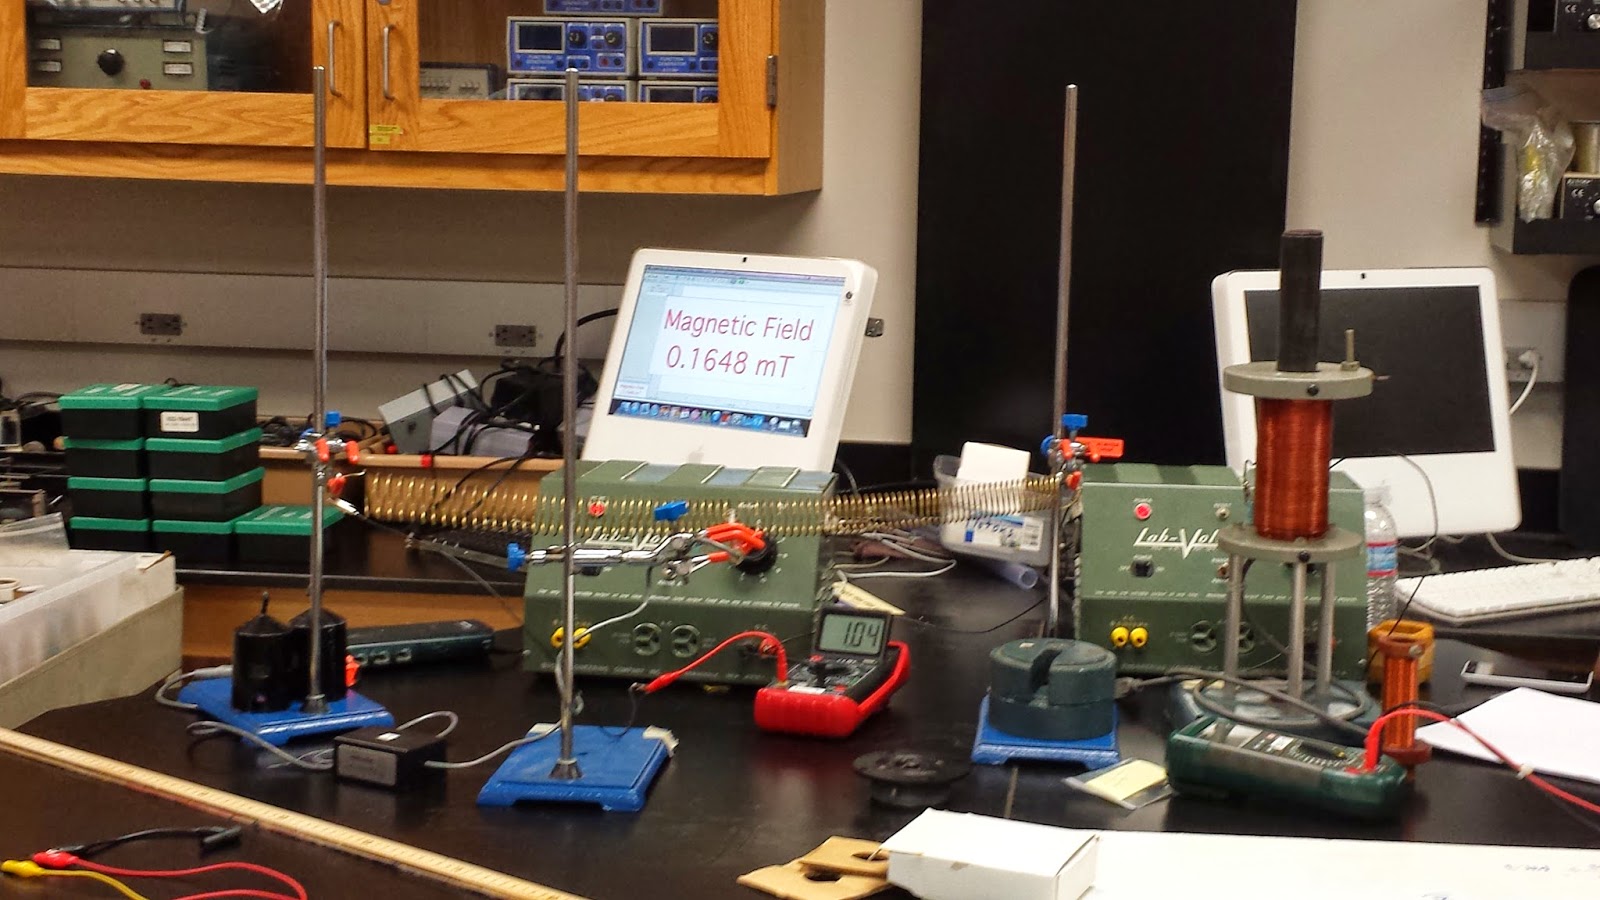
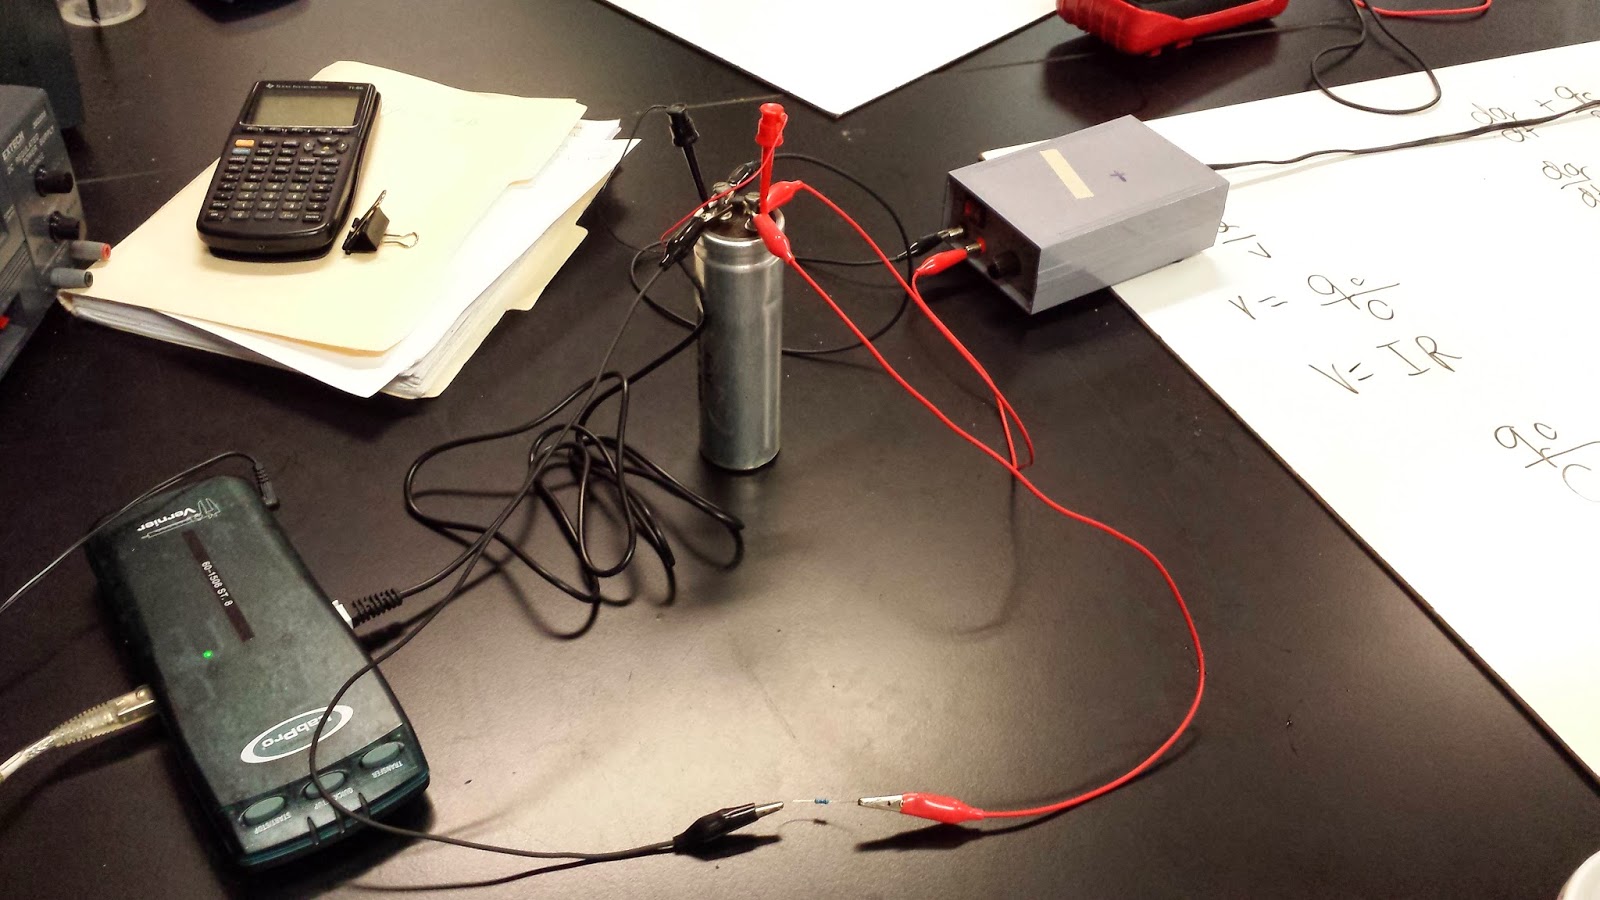
We used this board apparatus today, it was already set up for us. there are resistors, capacitors and a solenoid attached to it along with posts for our equipment. We connected these to a function generator and used the voltage probe to record voltage and current.


I vs V:


Our frequency 20 Hz. When we used higher frequencies, we got closer data to that of our theoretical calculations.

Sunday, June 1, 2014

Day 23:

 Activity #1 ActivPhysics


Experiment #1 Inductance


We used a solenoid, an oscilloscope and a function generator with a resistor to observe the graph and played with the settings until it matched the graph we had observed last week.

The graph is behaves like an exponential function. There is a period of charging and a period of discharging, and this is our comparison to that cycle when talking about capacitors. 


We calculated the inductance, L.

Sunday, May 18, 2014

Day 21:

Experiment #1 Measuring Earth Magnetic Field


The slope of this graph represents the magnetic field of  the earth. From the fit equation we determined that the earth magnetic field is 10.5 micro-Tesla.  The actual value is 25 to 65 micro-Tesla, and ourexperimental value is lower than the real value because of atmospheric considerations, such as the fact that we did our experiment inside a steel building.

Activity #2 Solenoid


We calculated the magnetic field of a solenoid, basically a very coiled conductor.


The calculated vs. the experimental value of the magnetic field is off by 0.04mT. 

Tuesday, May 13, 2014

Day 20:


Magnetic motors and magnetic fields


Experitment #1:


Attaching the power supply to the motor caused it to spin, and reversing the current's direction causes it to spin in the opposite direction.

Magnetic Motor:


The motor that our group created was composed of copper wire, several magnets and paperclips, and a power supply. A symmetrical oval shape was formed from the wire. One lead was sanded down 360 degrees while the other lead was sanded down half that amount. The paper clips were used as mounting points for the copper wire and placed on the top of the cup, and a magnet was placed inbetween the contraption as shown above. The current from the power supply is what moves the current through the wire and causes it to turn.


Sunday, May 11, 2014

Day 19:

Experiment #1 Field Directions


This demonstration illustrated the field waves around the "poles" of the magnet.

From this picture we found out that magnetic field lines come radiate, without intersecting, from one side of the pole into the other side of the pole.


We indicated the direction of the compass' point in several different locations around the magnet. From these lines, we found out that magnetic field lines go from the north pole into the south pole. So, a compass will point in the direction of the magnetic field lines.


Experiment #2 Magnetic Field, Force, and Velocity


In this demonstration, we used a rod, rails, and a power supply and predicted the directed the rod would roll.


Then we calculated the magnetic force.


Tuesday, May 6, 2014

Day18:


Activity #1: Amplifier


With this diagram as a blueprint to make an amplifier, we arranged our own capacitors and resistors and wires and connected them to an oscilloscope.


The resultant waves illustrates how the voltage is being amplified- the function on top is before amplification and the function on the bottom is after amplification. The bottom function has a noticeably larger amplitude.


Activity #2: AnotherAmplifier


This is an amplifier circuit arranged to amplify sound waves.


We used our phones to test the amplifier, which worked. The sound quality was actually quite good, but still imperfect.

Saturday, May 3, 2014

Day 17:


Oscilloscopes 


We used a function generator together with a speaker, an oscilloscope and a tap key to see how the various knobs and doohickeys affected the waves. We basically played around with it for a while and eventually got a feel for them


Sound From a Function Generator


We found that adjusting frequency altered the pitch of the sound produced by the wave. Amplitude controlled the volume or sound intensity. By selecting a different wave form, such as square wave, we found that the volume and pitch were both affected depending on our choice. The square wave was loudest.

The Vertical Voltage Axis


We turned the volts per division to 0.5 V and pressed the tap key. The line went up 3 divisions. The horizontal x-axis represented time and the y-axis represent voltage, so we multiply 3 x 0.5 (V/div) to get the battery's voltage, 1.5 V. It actually said 1.5 on the battery, too.

Lissajous Figures

Ratio 1:1 creates an ellipse figure

Ratio 2:1 creates an upside-down stretched infinity figure

Ratio 2:3 creates a fish shape

Ratio 2:1 creates an infinity figure


The pictures above are examples of Lissajous Figures. The shape of the figures are determined by the ratio of the two frequency received by the oscilloscope. The infinity symbol was my favorite. I instagrammed it with a caption that said "Physics Forever!" HA. Because infinity, get it?

Monday, April 28, 2014

Day16:


Experiment #1: Charging & Discharging Capacitors


We used a  power supply to charge and discharge a capacitor and used logger pro measure the voltage in the capacitor every few seconds. This gave a us a graph of our voltage over time. 


The blue line is the capacitor is charging and the red line is when capacitor is discharging. The slope of these graphs suggest that the rate at which voltage changes over time, or dV/dt, is is not linear. By fitting the curve we found the coefficients of the equation of this graph of an exponential function.

Tuesday, April 22, 2014

Day 15:

Activity #1: Measuring capacitance

For this Experiment we put aluminum foil between the page of a think physics book and set a multimeter up to measure the capacitance of this set up. In order to keep the capacitance consistent, we should have left the heavy side of the book on top.


We measured the capacitance of two separated sheets of aluminum foil which we varied in area and separation distance by folding the aluminum and adding more sheets of paper between the foils.


Our data suggests that the separation distance and the capacitance of the plates of a capacitor have a inverse relationship.


We measured  kappa,k, the dielectric constant. We calculated value of k to be 1.1,however the known value of k is actually 3.5. This is because we pressed the book in order to measure capacitance when the sheets were few.

Activity #2 Measure capacitance in series & parallel

Parallel
Series


We used a a multimeter and alligator clips to measure the capacitance of a capacitors in series and found that they  added in inverse, much as the resistors in series did.

Sunday, April 20, 2014

Day 14:


Activity #1


For this activity, we measured the current,  I, and voltage, V at several points in a parallel configuration as well as a series configuration. 


Activity #2 Decoding color for resistor


In order to practice recognizing the values or various resistors, we collected 4 band code resistors and 5 band code resistors and used the code legend to determine the rating of the each resistor.
.


Then we compared this calculated value to the measurements we took with an R-reader
For the 4 band code resistor we had about 99% accuracy. For the 5 band code resistor, we had slightly less with 97%.


Activity #3: Equivalent Resistances For Networks


We set up various resistors with known resistances in a combination of series and parallel configurations according to diagram that we were show. We calculated the value of its equivalent resistance and then we compared that value to the measurement taken by the R-Reader.


We were off by about 2%, which we considered a success.